Harmonics – ENA G5/5 Stage 3
This is a follow up to my post from the 17th June 2020, dealing with the new ENA G5/5 harmonics standard. The first post covered some general explanation of the standard and the specifics of Stage 2 process; this post will now tackle the slightly more complex issue of the Stage 3 assessment process i.e. for sites connected at 33kV and above, or those that fail at Stage 2.
Now before we get much further it is worth noting that harmonics is a tricky subject, and requires a good grasp of the theory, if you’re not too familiar with it I would suggest having a read on website like Voltage Disturbance or the Gambica guide (we have no affiliation with either of them).
As noted in the first post, the G5/5 standard has generally made things harder for developers, as the studies / assessment process is more difficult. At its most basic, this usually translates into more cost and longer turnaround times for the activities; so I think that for bigger plants developers will start to hit harmonic limits more regularly, so expect to allow for harmonic filters appearing on larger (20MW+) systems. The last point is especially important, finding you need a filter at the last minute is a disaster if you have not planned for it, but if there is sufficient space in the substation and plot, and contingency in the contract, then it can be managed & mitigated to some extent.
One grey area that is not discussed in the standard, is for projects that are mid-construction now, and that had the original connection offer made on the basis of G5/4. Technically speaking G5/5 should take precedent and in practice the new approach should be better, but the DNO might not have the information available, so if anyone is in this position I would suggest that they have some discussions with the DNO as soon as possible.
Key Changes in G5/5 Stage 3
As noted in the first post, there are several key changes associated with the new ENA G5/5 standard, these were touched on in the first post. For those readers who have skipped straight to this post, I have summarized them below in an easy bullet list format, and added a few more issues that are specifically relevant to Stage 3:
- The standard is now more aligned with IEC 61000-3-6
- There is more clear guidance on planning levels and compatibility levels, these are generally higher than the old G5/4 limits (a good thing)
- The harmonic level limits are given in terms of headroom, allocated on the basis of size of generator. This means that although the limits are higher, individual generators get less of them (not a good thing).
- Assessment is now potentially required up to the 100th harmonic – at the moment this is at the discretion of the DNO, so it may come in over the years rather than straight away.
- Higher order harmonics are now aggregated on an exponent law, rather than through simple summation, this means that higher order harmonic failures will be slightly less common – but inverters that are noisy on the lower orders will be penalized.
- Stage 2 is now split into three sub-stages, and actively considers the background harmonic levels. This means that Stage 2 assessments will be a bit more complex and need direct information from the DNO.
- Stage 3 is still for all connections at 33kV and above, or for failures at Stage 2.
- There are now special rules on connection of ‘resonant plant’ (i.e. anything capacitive), in practice this means that long cable feeders, power factor correction units, harmonic filters and so on all need special attention.
- Stage 3 connections require the DNO to provide a harmonic specification to the developer, detail the background harmonics, apportionment limits and (interestingly) the harmonic impedance loci…. More on this later!
- The standard specifically recommends adopting the practices given in CIGRE Electra 167. Interestingly there is no reference to the recently released CIGRE technical brochure on the subject – “C4/B4 – Network Modelling for harmonic Studies No 766”, which is very comprehensive
- Inter-harmonics and voltage notching are given a more thorough approach – this will probably not make too much difference unless you are dealing with big variable speed drives or MVDC / HVDC converters though.
- The harmonic impedance loci the DNO has to provide to developers, should make modelling the system simpler, but I have a suspicion the DNOs might not have this information as readily available as we hope.
Stage 3 Overview
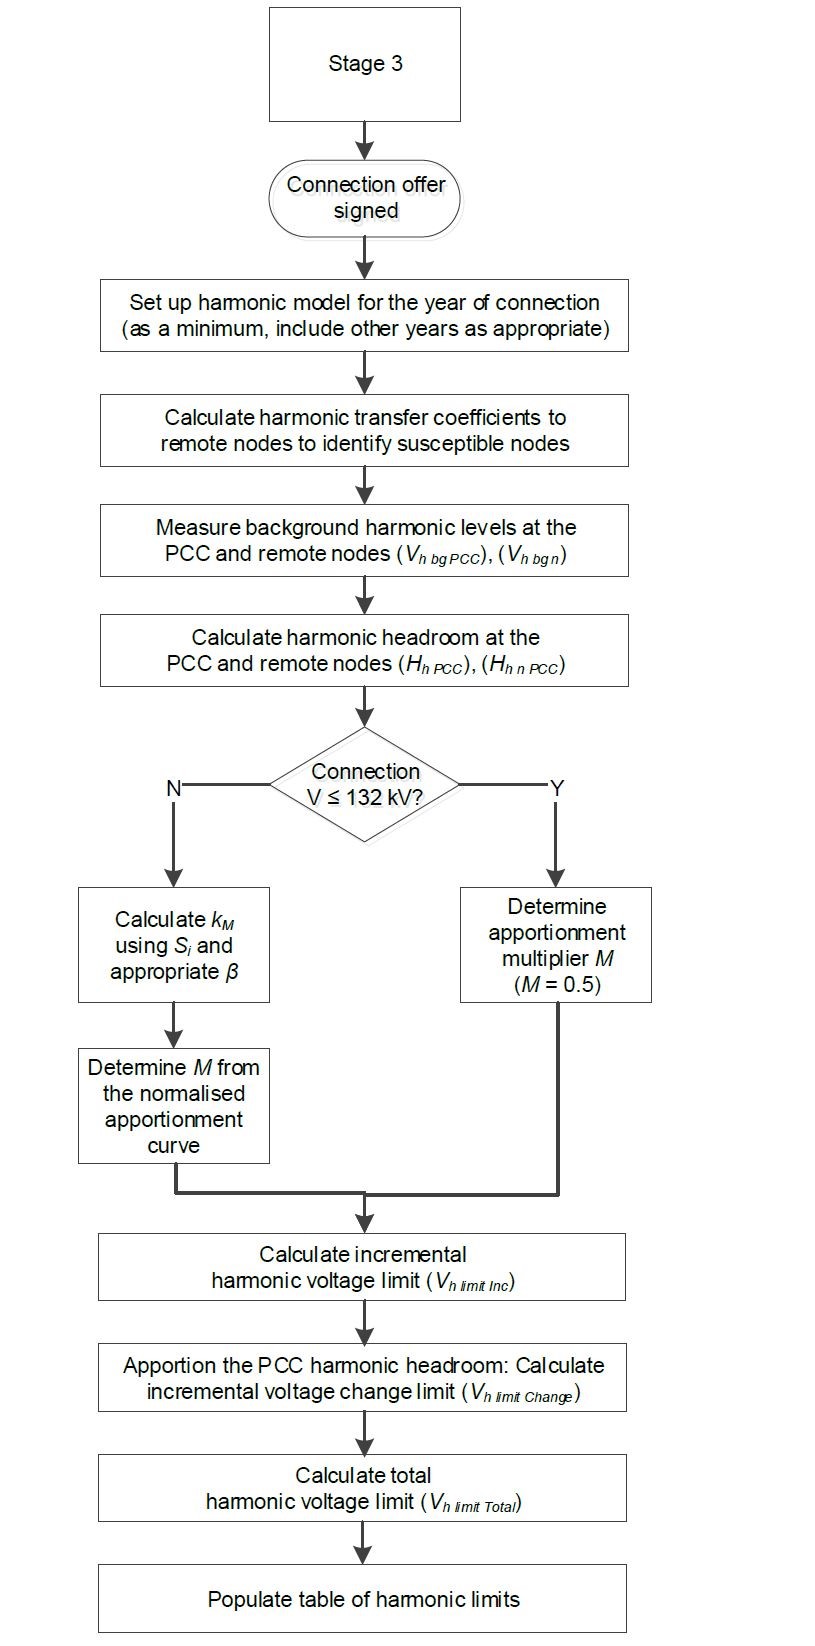
Stage 3 is still reserved for MV connections at 33kV and above. The process is now a bit more formulaic and puts a bit more pressure on both the DNO and developer. The real key difference is that the DNO have to provide the developer with a harmonic specification for carrying out the assessment, this specification is very specific and not simple for the DNO to organize and means the DNO will have to think ahead and plan their connections more carefully. So, expect more cost and delays getting this information from the DNO. Similarly, when the developer get the DNO harmonic specification, there will be more information to sift through, and manage but modelling of the DNO network is much simpler and less time consuming. The basic Stage 3 process is shown below, in the form of a flow chart (extracted from G5/5).
The DNO Harmonic specification
The new DNO harmonic specification is where things start to get difference from G5/4, although in practice this formalizes what many DNOs were starting to do anyway. The DNO must now provide an outline of the harmonic requirements that must be met, to achieve compliance with the system. These contents of the DNO harmonic specification are summarized below for ease of reference:
- Impedance profile of the PCC in the form of impedance loci or tabular data.
- Background harmonic level.
- Limits for incremental harmonic voltages (% h = 1) produced by the new user’s plant or equipment emission at the PCC. This is referred to as Vh Limit Inc.
- Limits for resultant total harmonic voltages at the PCC, accounting for the incremental harmonic voltages due to emission from the new user’s plant or equipment and the modification of the background harmonic level. This is referred to as Vh Limit Total.
The last 3 bullet points sound complicated, but they are really just a formalization of what we used to do under G5/4, i.e. look at the background harmonic with and without the plant connected and determine what the incremental harmonics are against the limits. Although in G5/5 we are now working against headroom limits rather than actual planning limits.
It is the first bullet point that is where things get interesting. Harmonic impedance profiles of the DNO system make things sound complicated, but they should actually make life a bit easier. To understand what’s going on here, we need to do a bit of theory and understand what harmonic impedance is, we will come onto that later, but first let’s look at the more classical (simple) harmonic loadflow assessment part of a Stage 3 assessment.
Assessment of Harmonic Loadflow
The harmonic loadflow analysis process is broadly similar to what used to happen in G5/4 (and similar to Stage 2C), although the flow and presentation of the results is slightly different. The big change is that we now have higher harmonic emission planning limits (i.e. the maximum allowable distortion levels) which are allocated on an apportionment basis, and there is a requirement to perform the assessment up to the 100th harmonic.
Apportionment limits are actually a pretty sensible approach and should benefit developers as a whole, although individual projects may take a hit. This means that a developer who is ahead of the queue from another project in the pipelines, won’t be able to gobble up the whole harmonic planning limit, if their design is based on cheap noisy equipment. In other words the planning limit of specific harmonic orders, is split into headroom, which is now shared between customers, based on their connection voltage (and also generation size).
In simple terms where an individual harmonic had a planning limit (i.e. the 5th harmonic has a planning limit of 2.8% at 33kV) then a developer is only allowed 50% of this limit if they are connecting at 132kV and below (it is slightly more complex for voltages above 132kV). Formally, this can be shown as:

This means that going forward there is less headroom available to a customer. However, the good news is that G5/5 now uses the IEC 61000-3-6 approach and limits (using exponent laws), and so whilst a developer has a headroom allocation, the overall limits are higher so that the net impact should be broadly the same. Although expect to hit some problems, particularly if a developer has kit that emits noise on even harmonics or lower order harmonics <13th, and developers with larger sites (i.e. 15MW and above) connecting at 33kV will have a tougher time than those connecting smaller sites.
Analysis up to the 100th harmonic sounds like a big deal, but it probably isn’t really – it will be phased in gradually, and it means that manufacturers will start having to report higher order harmonics for inclusion in the mode, this isn’t really much more difficult to include in the simulation analysis so doesn’t really affect consultants too much. Assessment to the 100th is at the DNO discretion, so I would imagine this will only being slowly, as most of the manufacturers wont have this information; but I can see potential issues arising in a year or twos time when the DNOs are less forgiving and some manufacturers have not got their act together.
As noted, in the previous blog post, there are a couple of nasty clauses in G5/5 that I have an issue with. First it insists that the analysis takes into account the worst emissions based on the loading of the inverter. As we know, for most inverter driven generators, the harmonic emissions depend on its loading i.e. you might find that at full power the 5th harmonic produces 20% current harmonic, but at 50% load this increases to 25% – what this means is that at part load, there is less current being injected, but the current is dirtier, than at full load. Secondly, there is a similar requirement to take into account the worst value on each individual phase of a 3-phase equipment, and of the background harmonics.
The result of these two additional requirements, is that the assessment will become pretty conservative and may create some odd results for any sites near plants with heavy single phase loads like rail supplies or metallurgical works. I personally think this is unfair, but it should prevent any surprises from occurring once the equipment is connected, and hopefully eliminate the need for post installation harmonic surveys.
Once the system model is created, loadflow assessments are carried out with new inverters connected and the background harmonics switched off, and look at the voltage levels for Total Harmonic Distortion (THDv) individual harmonic order incremental increase (in %), and this gives us our incremental increase. We then rerun the harmonic loadflow study with the background harmonics on and determine the future harmonics levels (i.e. existing + new) and compare these with the planning limits.
Assessment of Harmonic Impedance (aka frequency sweep)
As with the old G5/4 standard, the key difference between a Stage 2 and Stage 3 assessment, is that stage 3 assessments, requiring assessment of the system Harmonic Impedance to try and identify and resonance points. Harmonic Impedance is a slightly tricky concept but is pretty easy when you understand what it is and what it’s trying to achieve. First, it’s a good idea to take a step back and make sure the theory of what harmonics and resonance is all about.
A resonance point, is where the combination of RLC components forms a series or parallel condition where the inductance and capacitance either cancel each other out and form a low impedance path (series impedance), or combine to form a very high impedance (parallel resonance). A ‘normal’ (and I use that term loosely) just should see a steady increase in harmonic impedance as the harmonic order increases – this is because most networks are inductive and as XL = 2πfL, XL gets bigger as the frequency f gets bigger.
Graphically you can see it below (this image was Voltage Disturbance[1], which have a nice tutorial on power quality), where you can see both a parallel resonance as a peak and a series resonance as a low point
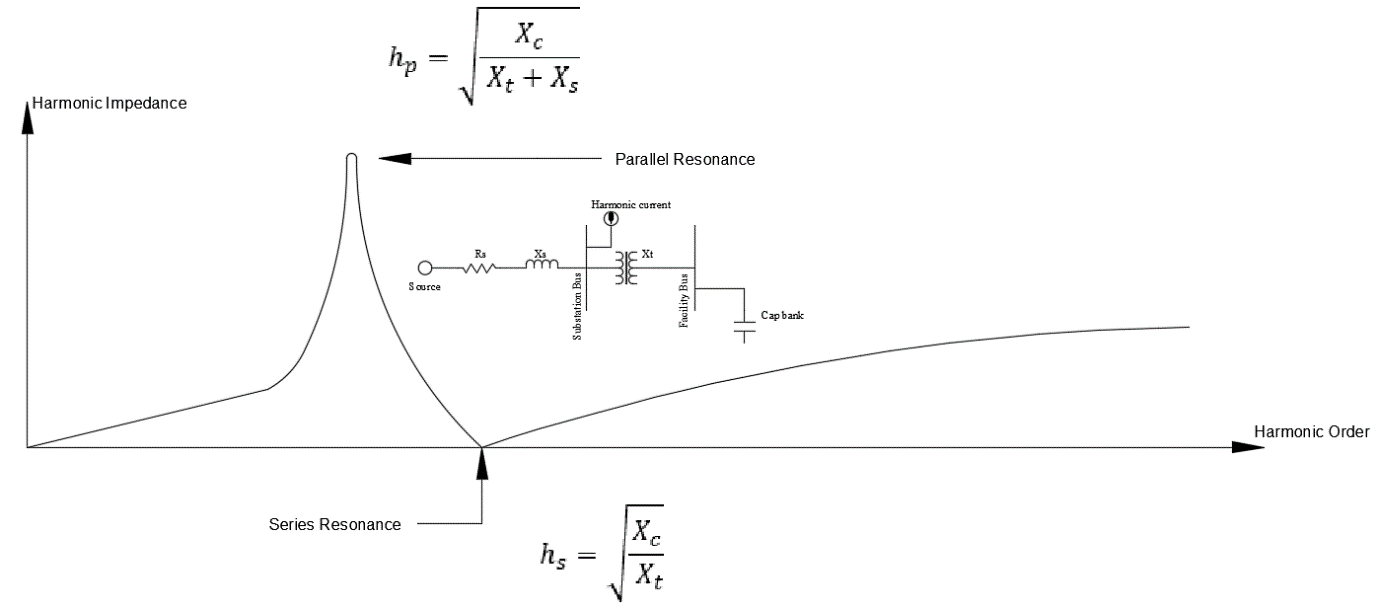
Resonance points are bad news, they can cause all sorts of negative behavior on the system, from stray heating to nuisance tripping of relays to large overvoltage and destruction of equipment. Resonance points must therefore be identified and if they are too large, removed through use of a filter or other such method.
To understand the new approach, we have to backtrack slightly to see how we used to do it in G5/4. What studies engineers had to do, was model a large(ish) part of the DNO network from the available LTDS data, and then use a driving point source at the Point of Connection to see what happened on each of the nearby DNO busbars to look for sudden changes in impedances at specific harmonic levels.
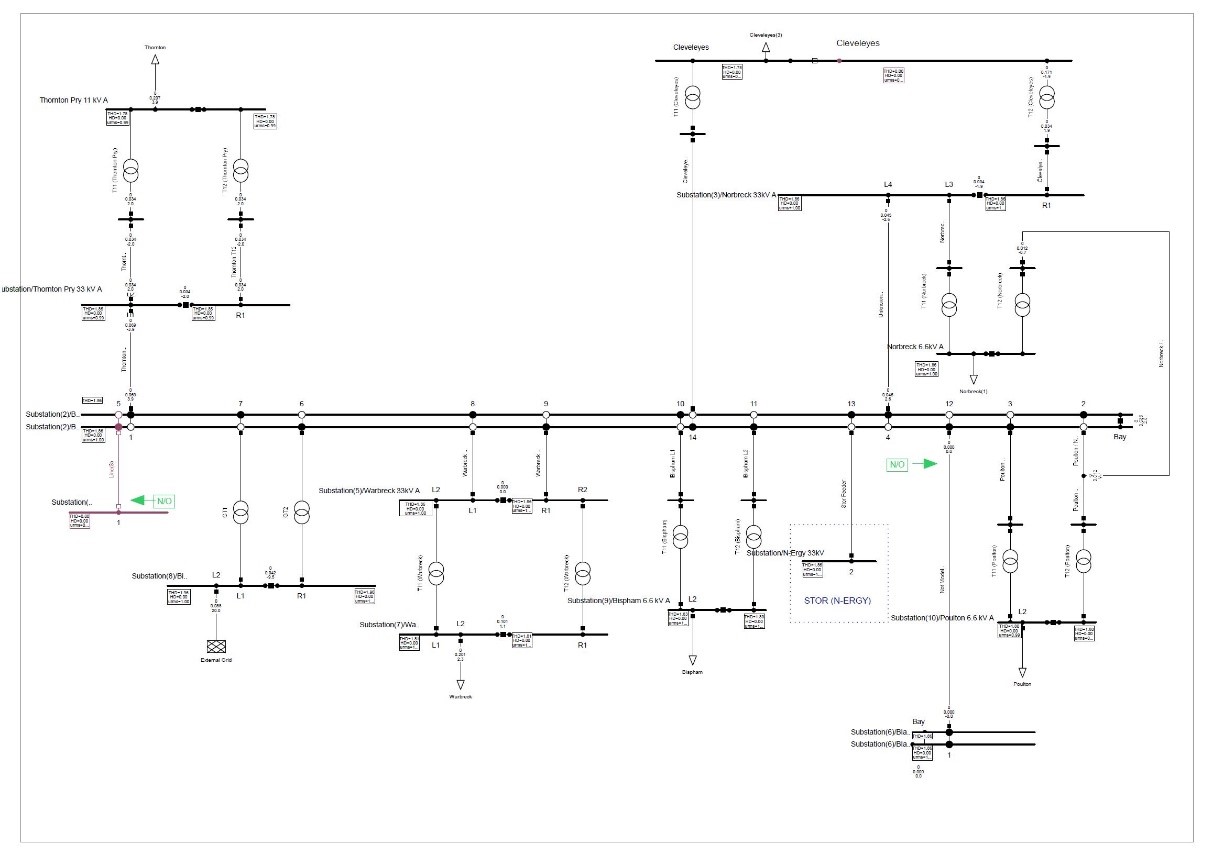
In practice what this means is that the consultant would end up with a model that looks something a bit like as shown below, and then a number of harmonic impedance plots (sometimes called frequency sweeps) as shown below as well. We would then run a few different scenarios, where we consider different system outages to see if this changed anything and made matters better or worse.
Below is a nice and simple model of a 33kV, 11kV and 6.6kV DNO network that is fed by a pair of 132/33kV Grid Transformers, and where we represented the rest of the 132kV system by a simple External Grid element.
The problem with the old method is its laborious, subjective and and frequently contentious. Building a model up from the LTDS data is always hard, as data is often missing key parameters, contained mistakes and different engineers and DNOs have different views on what is correct in terms of the extent of the model i.e. including skin effects for cables (usually a good idea), skin effect for transformers (a slightly questionable benefit). System loading of winter / summer loads, what happens between night and day loads and so on. Then there is the thorny question of how much of the DNO network to model, more detail is good, but takes time and may not be useful, then questions of modelling the upstream (National Grid network) start to arise.
So that issue aside, we can see that the DNO model we created gives us a whole range of paths from our connection point back to the various DNO busbars. These paths are made up of the various cables, overhead lines, transformers and loads etc. that sit on the network and it is these paths that can create possible RLC series and parallel resonances.
The new G5/5 Impedance Loci Approach
The new approach in G5/5 is more in line with what bigger TSOs have been doing for a while, and this is basing the harmonic assessment on using harmonic impedance profiles of the DNO network to represent their system, rather than messing about having to build a model of it. So what G5/5 allows the DNO and the consultant to do, is convert the DNO’s large and messy background model into an equivalent harmonic impedance (sometimes called a frequency dependent characteristic) of their network, at the point of connection.
This can be provided in the form of a tabular set of data of in impedance loci (X-R) diagrams. Tabular is ok, but usually a bit basic, whilst impedance loci let a huge amount of data be displayed for a number of operating cases. Some typical impedance loci can be seen below (extracted from CIGE 766):
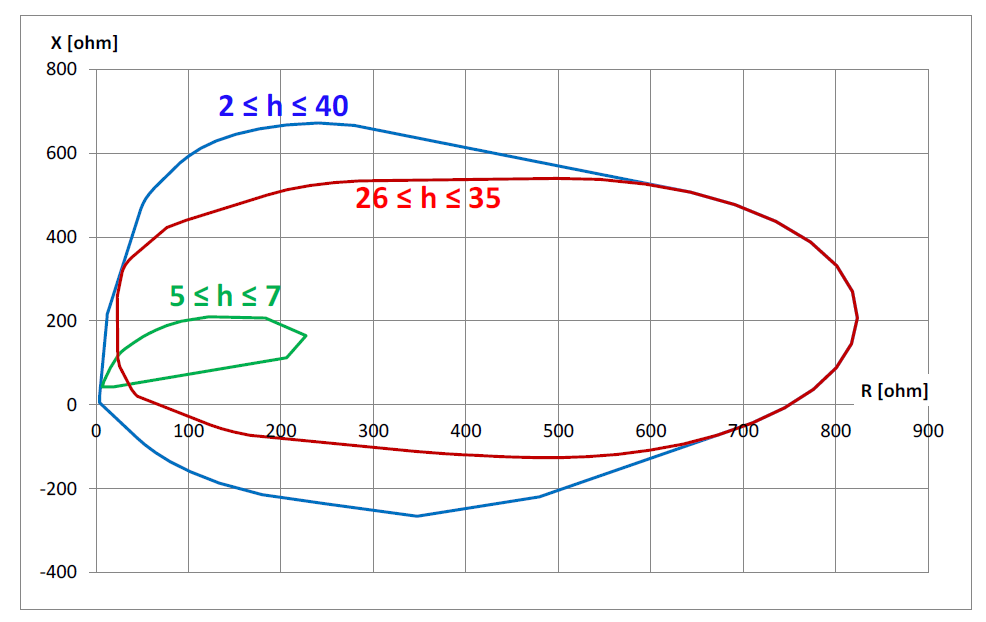
These loci diagrams, whilst being initially a bit confusing to read, give a whole wealth of data for all the possible operating cases of a system. The loci’s are usually split into different harmonic orders, which can be 3 or 4 groups (as shown above), or for complex systems maybe 7 or 8 or even more. The thing we are looking for in the above, is any points where the curves cross from the positive X to the negative X (i.e. 0 values of X), as this indicates a resonance point.
Now we understand what harmonic impedance is about, we can see that if the DNO gives the consultant the correct information, then the consultant no longer needs to model a large part of the DNO network, as the impedance loci provides the same information in a different format. The catch is, that the impedance loci are only for a specific point in the network… so it’s quite possible the DNO will only produce them for strategic substations (i.e. large BSP and GSP points) within the system, and the consultant will need to model up to that point – time will tell on that.
Once the consultant has the harmonic impedance loci, they can load this into their analysis package of choice (at Aurora we use DIgSILENT PowerFactory for this kind of assessment), and then run a number of different cases and assessments to see what the impact of the connected harmonic loads are. At this point the assessment is looking for any significant changes in the harmonic impedance information, that indicates if we are making things worse for the DNO and the other users on the system.
Summary
As can be seen above, although it looks a bit messy Stage 3 should make the assessment process easier, but there are likely to a number of pitfalls. The DNO will have to provide a harmonic specification, and this is likely to take time, it is also likely that some DNOs will struggle to provide the correct information in the correct format and this may lead to delays. Then the apportionment limits may start throwing up strange results and unfavorable results for certain. If there are two bits of advice to take away from this, they are for large sites (lets say 20MW and above).
1) For developers / ICPs to give themselves more time to get the assessment done and the various cycles and comments that will invariably happen.
2) Have a contingency plan for what to do, if the harmonic assessment fails i.e. have cost and plot space put aside to put a harmonic filter in if you need to.
As always if you have any questions please drop me a line!
[1] https://voltage-disturbance.com/power-quality/harmonic-resonance-in-power-systems/