Grid Connected Battery Energy Storage Systems – Dynamic Containment
Part 1: Introduction
This post is a follow on to our previous post, which discussed battery energy storage in general, and its application to power arbitrage.In this post we talk about battery storage & P28/2, which is the UK standard on voltage disturbance. This topic is very relevant due to the increasing interest in the National Grid ESO Dynamic Containment (DC) market.
As we noted in a previous post, Battery Energy Storage Schemes are very versatile plants and can be used for a number of different services, depending on the plant design and aims; this can include services such as power arbitrage, voltage control, and the new Dynamic Containment service which replaces the old Enhanced Frequency Response (EFR) service. BESS units can also be used as a power balancing service, to meet shortfalls in power, to limit disturbances from the grid during transient switching events, where a plant has large dynamics loads, such as big motors and generators that switch in and out frequently.
At Aurora we have found that many developers are keen to add battery storage systems into their existing projects, but are often unsure exactly how the battery will be used. This leads to the dilemma of trying to design a system that will be flexible enough to allow future revenue streams, without pre-investing for expensive system upgrades.
This post gives a simple guide to explain the basic ideas of what Dynamic Containment is and does, how it operates and how Battery Energy Storage System & P28/2 interact.
Part 2: A Bit of History and Inertia
Dynamic Containment (DC) is a relatively new service deployed by National Grid ESO, which is intended to support the grid system during frequency disturbances. That is a slightly fancy way of saying it provides rapid bursts of power when there is a shortfall of MW, but it does a few other things as well.
Before we talk about DC, it is worth taking a step back and understanding what it is for and why its needed. In historical power systems, power was pretty much universally created by spinning large lumps of magnetically conductive metal, inside large magnetic fields inside (or vice versa). As well as providing our electricity this approach provided an inherent benefit that was not often actively considered until recently, which is that of inertia. In very simple terms, this is the amount of stored kinetic energy in the grid at a given time, and during a system disturbance the kinetic energy of the various rotating masses was decreased slightly to meet any shortfalls in power, this allowed the various primary response mechanisms, such as the generator governors to kick-in and rebalance the system. This is shown diagrammatically below in Figure 1, and is covered in glorious detail by the famous Prabu Kundur, and the well know Power System Stability and Control book[1]. For those of you who are mathematically minded, the system response is given by the Swing Equation given in various formats in (1) and (2).
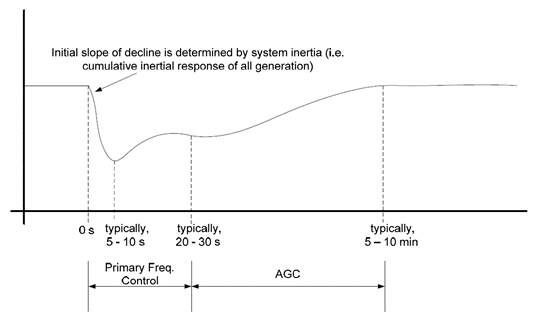
Figure 1 System Response
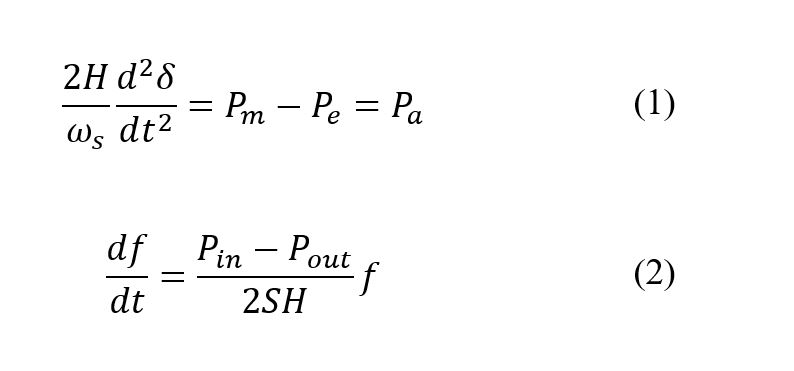
What we know from these equations is that as the overall system inertia falls (H) compared to the system power (S), the rate of change of frequency (RoCoF) will increase for the same amount of a power shortfall. To put this into context, lets say the UK system is rated as 20 GW, and has an overall inertia constant of 4 (i.e. 80 GVA.s), and we have a system loss of 1000MW. This would give a RoCoF of 0.3125Hz/s, but if the inertia constant of the system was only 1 ( i.e. 20GVAs) then the same loss would give a 1.25Hz/s RoCoF.
To put that into context the Low Frequency Demand Disconnection (LFDD) in the UK kicks into action at 48.8Hz (aka August 2020 blackout). So, with a system inertia constant of 1, you would have only 1s to correct the power imbalance before LFDD was triggered, with an inertia constant of 2, you would have 2s to correct the power imbalance and so on.
In power systems control time, you need anything from 0.5s to 5s to start getting a conventional governor response, and these conventional generators can only ramp power at a given rate, due to their own control settings and thermal limits. As the conventional generation power increases its output the power imbalance becomes smaller and the RoCoF rate reduces, until a new equilibrium point is reached.
With a low inertia system, the system frequency can collapse quickly and hit the LFDD limit, before the conventional generators governor response can make enough of a difference. This is where DC (and its predecessor of EFR) come into play, they are designed to provide fast acting power to meet the shortfall, while they conventional generators can respond to re-balance the system.
If this all seems a bit academic, then the key points to take away from this is the following. Inertia is a critical parameter in a power grid, and it gives the system time to respond to allow conventional generators to increase their power output. Inertia is produced by conventional rotating plant, and with a falling system inertia, this time the system has to respond is reduced, and this means that there will be an increasing need for fast frequency response systems, to prevent system collapse.
Part 2: Dynamic Containment
DC is intended to provide post fault power to help stabilise the grid and providing fast response services that are in need in modern grids, which tend to be high in renewable penetration, low inertia and low in Short Circuit Ratio (SCR). The formal requirements for DC are given on the National Grid ESO website.
In very simple terms, the DC requirements can be seen below in Figure 2, and from a simple inspection, we can see that the DC performance requirements are pretty strict. There is a small dead-band of ±0.015Hz and, according to the current National Grid ESO guidance, the performance requirement, is that a frequency deviation is detected within 500ms, and the storage unit is able to reach its required capacity within 1s. What this means is that there needs to be some reasonably sophisticated measuring equipment to track and sample the grid frequency waveform, and then some fast acting inverters coupled with fast acting storage units that can rapidly increase their power output.
In theory the DC requirements are technology agnostic (i.e. anything can be used providing it meets the performance requirements) based on a storage system being able to produce or absorb energy during frequency deviations, from the system nominal operating point of 50Hz, following a system disturbance (i.e. fault).
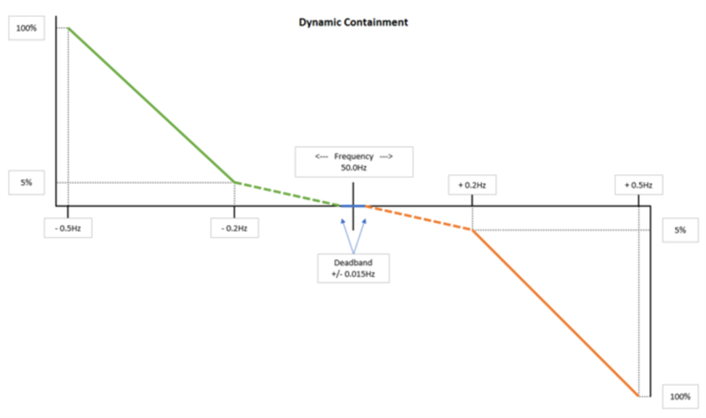
Figure 2 DC Performance Requirements
It the above all sounds easy, well it is. Sort of. As with anything electrical the devil is in the details. Obtaining appropriate grid capacity is the usual treasure hunt that we all know and love, but once the grid capacity is found we can just use it right? Well not quite, a key difference between a DC system and a Solar PV site is that the power swings can be significant. Solar PV ramps up slowly, in line with the irradiance levels, but a DC system could well be recharging itself at full import and then suddenly need to provide full power output in 1s. Such a significant power change will cause a voltage disturbance on the host DNO / TSO system, characteristic of a rising voltage, as the DC system discharges.
Within the UK, this is governed by the ENA P28/2 standard, which dictates the following limits (it is well worth having a read of section 5.3.2 of the standard). What we can see in the table below, is that the under-voltage limits, are relatively ‘generous’ and were borne out of the need to manage transformer energisations and re-energisation of renewables more satisfactorily. DC type services produce over-voltages, and these are pretty similar for all case, and have similar limits which are less ‘generous’.
| Category | Classification | Voltage Decrease | Voltage Increase |
| 1 | Frequent Events | ≤6% for 100ms
≤3% after 100ms |
≤6% for 100ms
≤3% after 100ms |
| 2 | Infrequent Events | ≤10% for 100ms,
100ms ≤ 6% ≤ 1.9s ≤3% after 2s |
≤6% for 200ms
≤3% after 200ms |
| 3 | Very Infrequent Events | ≤12% for 100ms,
100ms ≤ 10% ≤ 1.9s ≤3% after 2s |
≤6% for 200ms
≤3% after 200ms |
The key thing to note here is that the magnitude of the voltage deviation experienced by the DNO / TSO system depends on three main factors. 1) The MW size of the battery, 2) the strength of the DNO network (i.e. its fault level) and 3) the speed of the power ramp. These factors all need assessing to ensure that the system remains with the ENA P28/2 limits, if it is to be compliant during operation.
Part 3: Applications – 50MW BESS for DC
In this section, we will put our theory from the previous sections into practice. Let us suppose for this scenario, a developer knows they want to specifically provide a DC service to National Grid ESO. They have identified a suitable connection site, and want to deploy a specific capacity of 40MW, as this is the available headroom at the supply point. Once we are sure the system is capable of supplying the power, we need to check if it is robust enough to support a power swing whilst staying inside the ENA P28/2 limits.
Depending on how the battery is operated and managed there are numerous cases of power swing that could occur. From a studies and DNO’s perspective, we usually look at the two worst (bounding) cases, to see how the system responds, so it can be seen that there are two main different scenarios can arise:
- Battery at full -40MW import and system frequency falls to 49.5Hz – requires power demand to +40MW (export) within 1s, +80MW/s swing occurs.
- Battery at full +40MW export and system rises to 50.5Hz – requires power demand to -40MW (import) within 1s, -80MW/s swing occurs.
Note that for this we are neglecting the slightly nonlinear DC response curve and simplifying slightly, to make the calculation a little easier. What we are looking for here is the voltage change that occurs at the Point of Common Coupling. As our power is nominally fixed, the main factor that will influence the voltage deviation is the strength of the DNO system i.e. the fault level.
We can set up a simple model of a battery storage system connected to a typical 33kV busbar (Figure 3), as seen below and then run the various cases we are interested. For illustration purposes we have used four different fault levels, starting at 2.5kA through to 10 kA. The results are summarised in the table below and Figure 4.
| Grid Strength | Power Swing | Steady State Voltage Change (%) | Compliant |
| 2.5 kA @33 kV
143 MVAsc |
-80MW/s | 4.627% | No |
| 5 kA @33 kV
286 MVAsc |
-80MW/s | 2.84% | Yes |
| 7.5 kA @33 kV
429 MVAsc |
-80MW/s | 1.82% | Yes |
| 10 kA @33 kV
571 MVAsc |
-80MW/s | 1.53% | Yes |
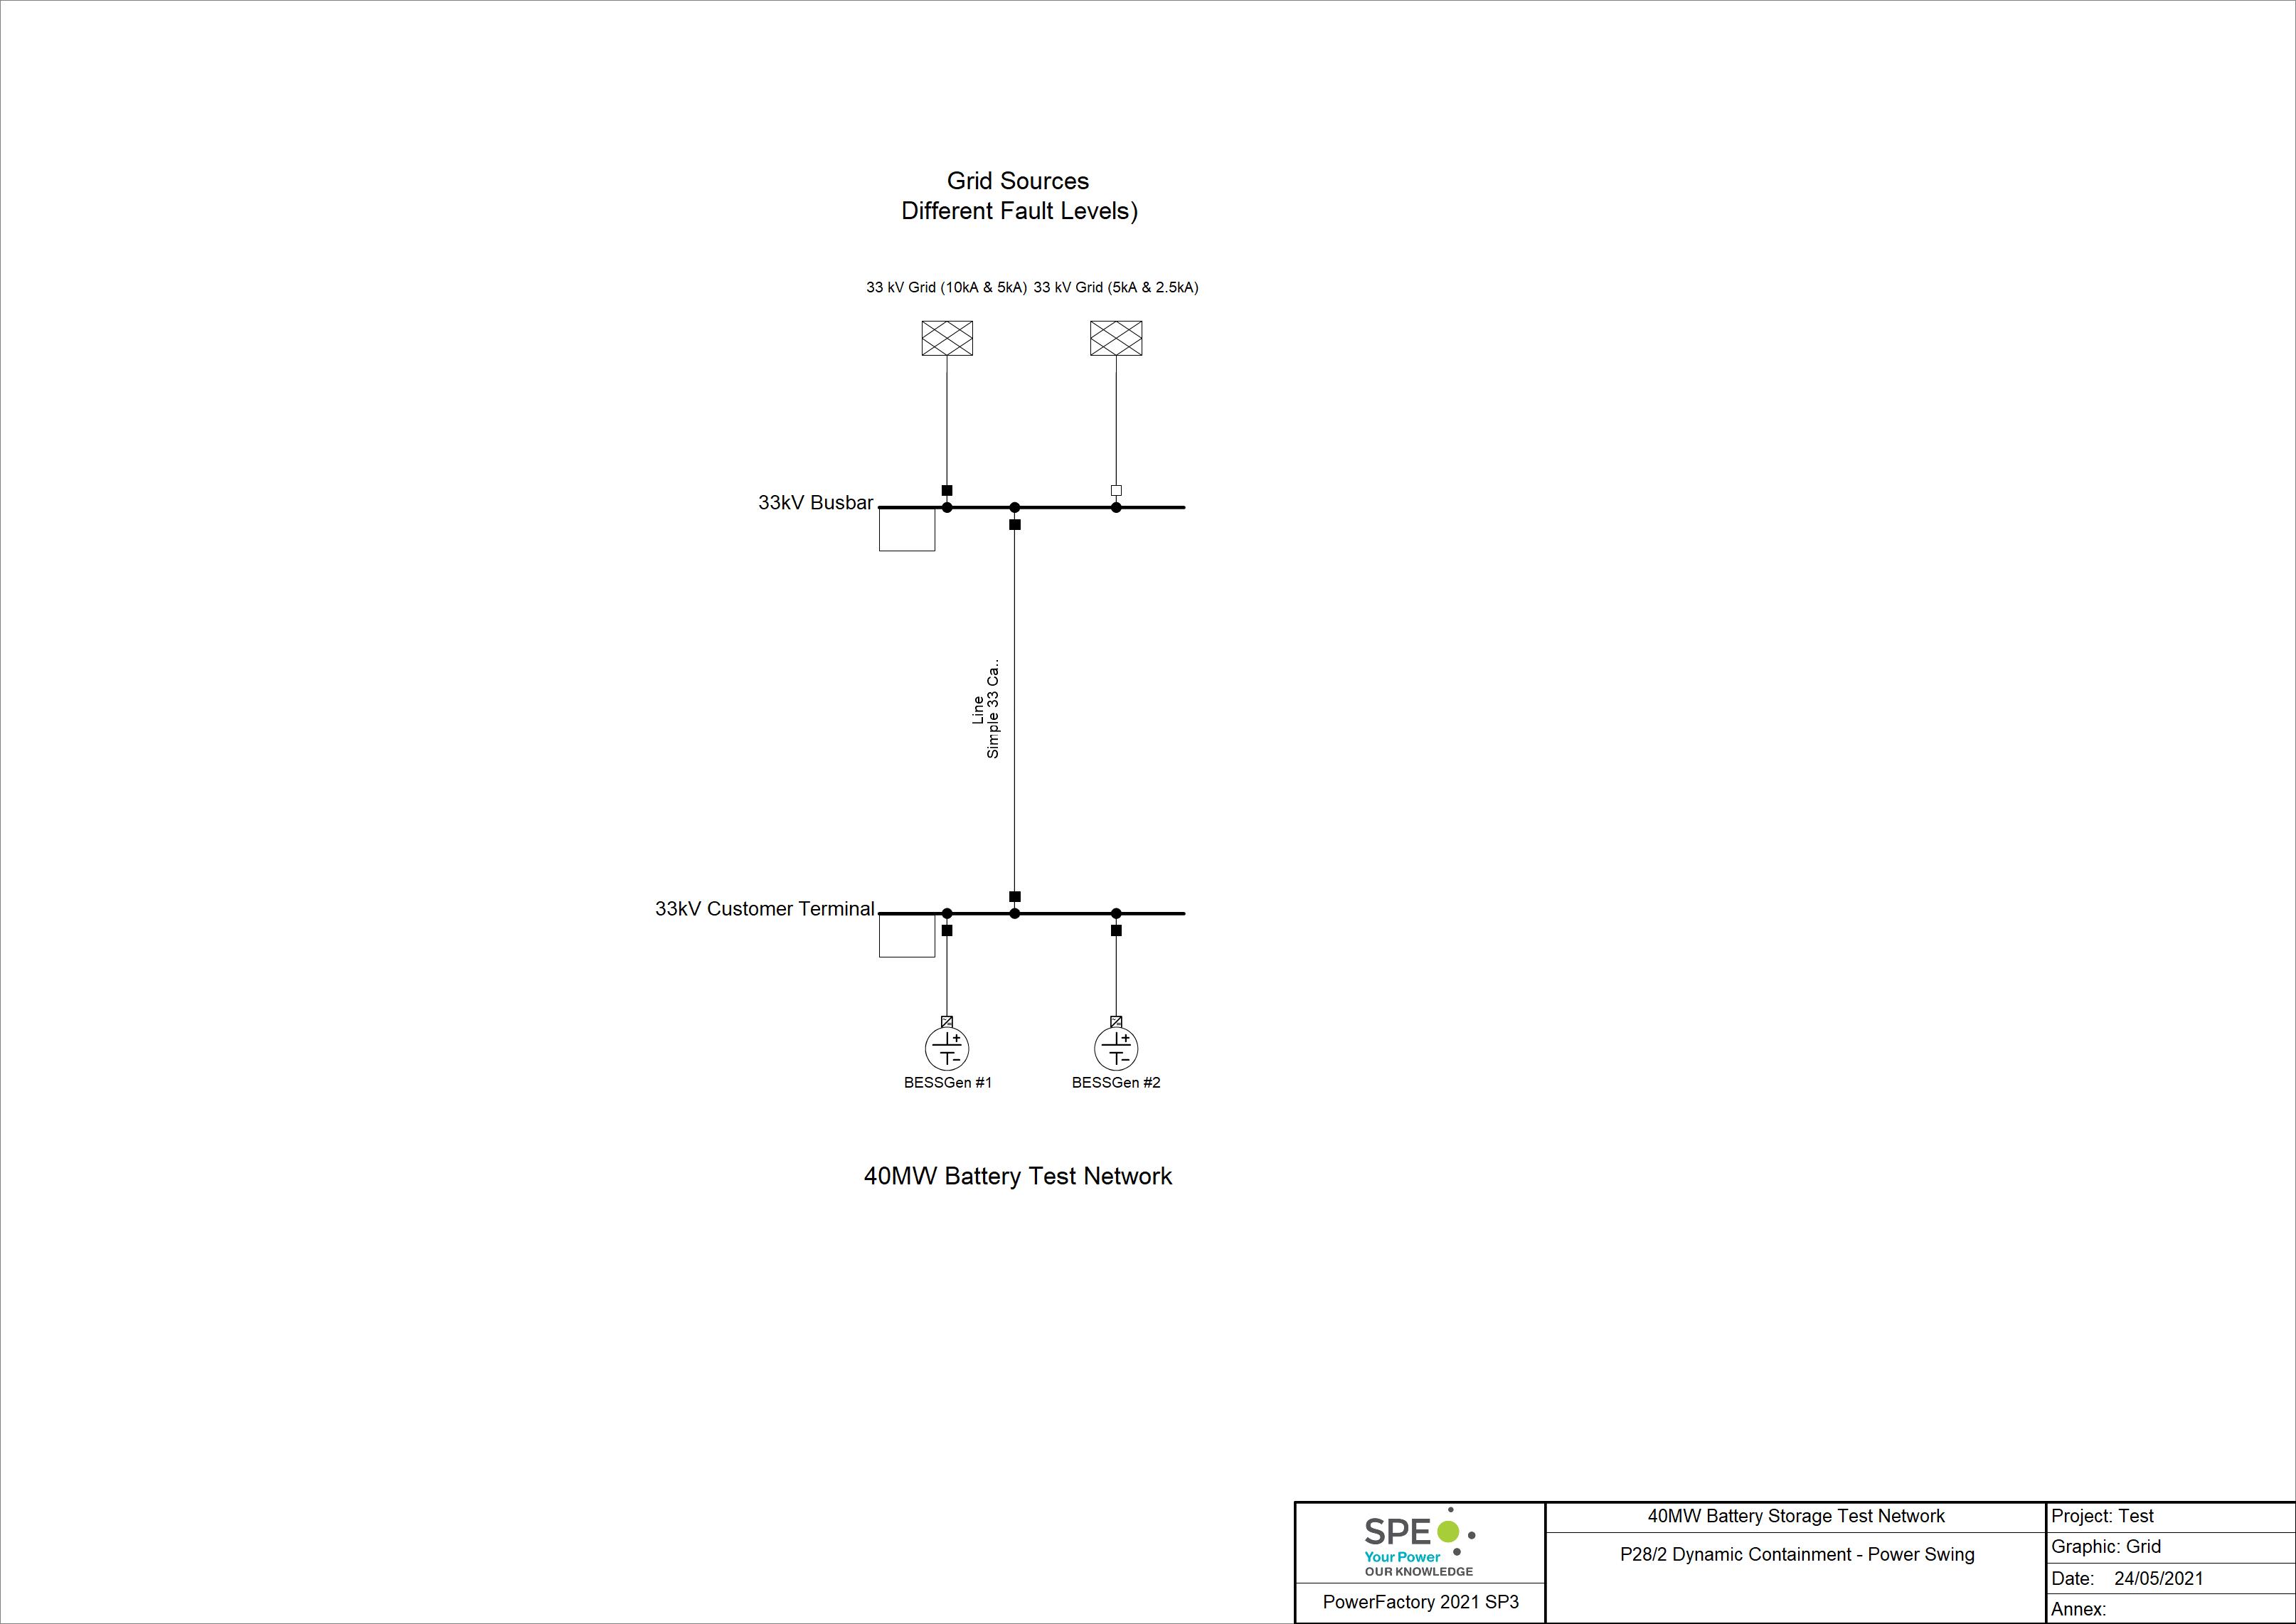
Figure 3 80MW Power Swing vs DC Performance Requirements
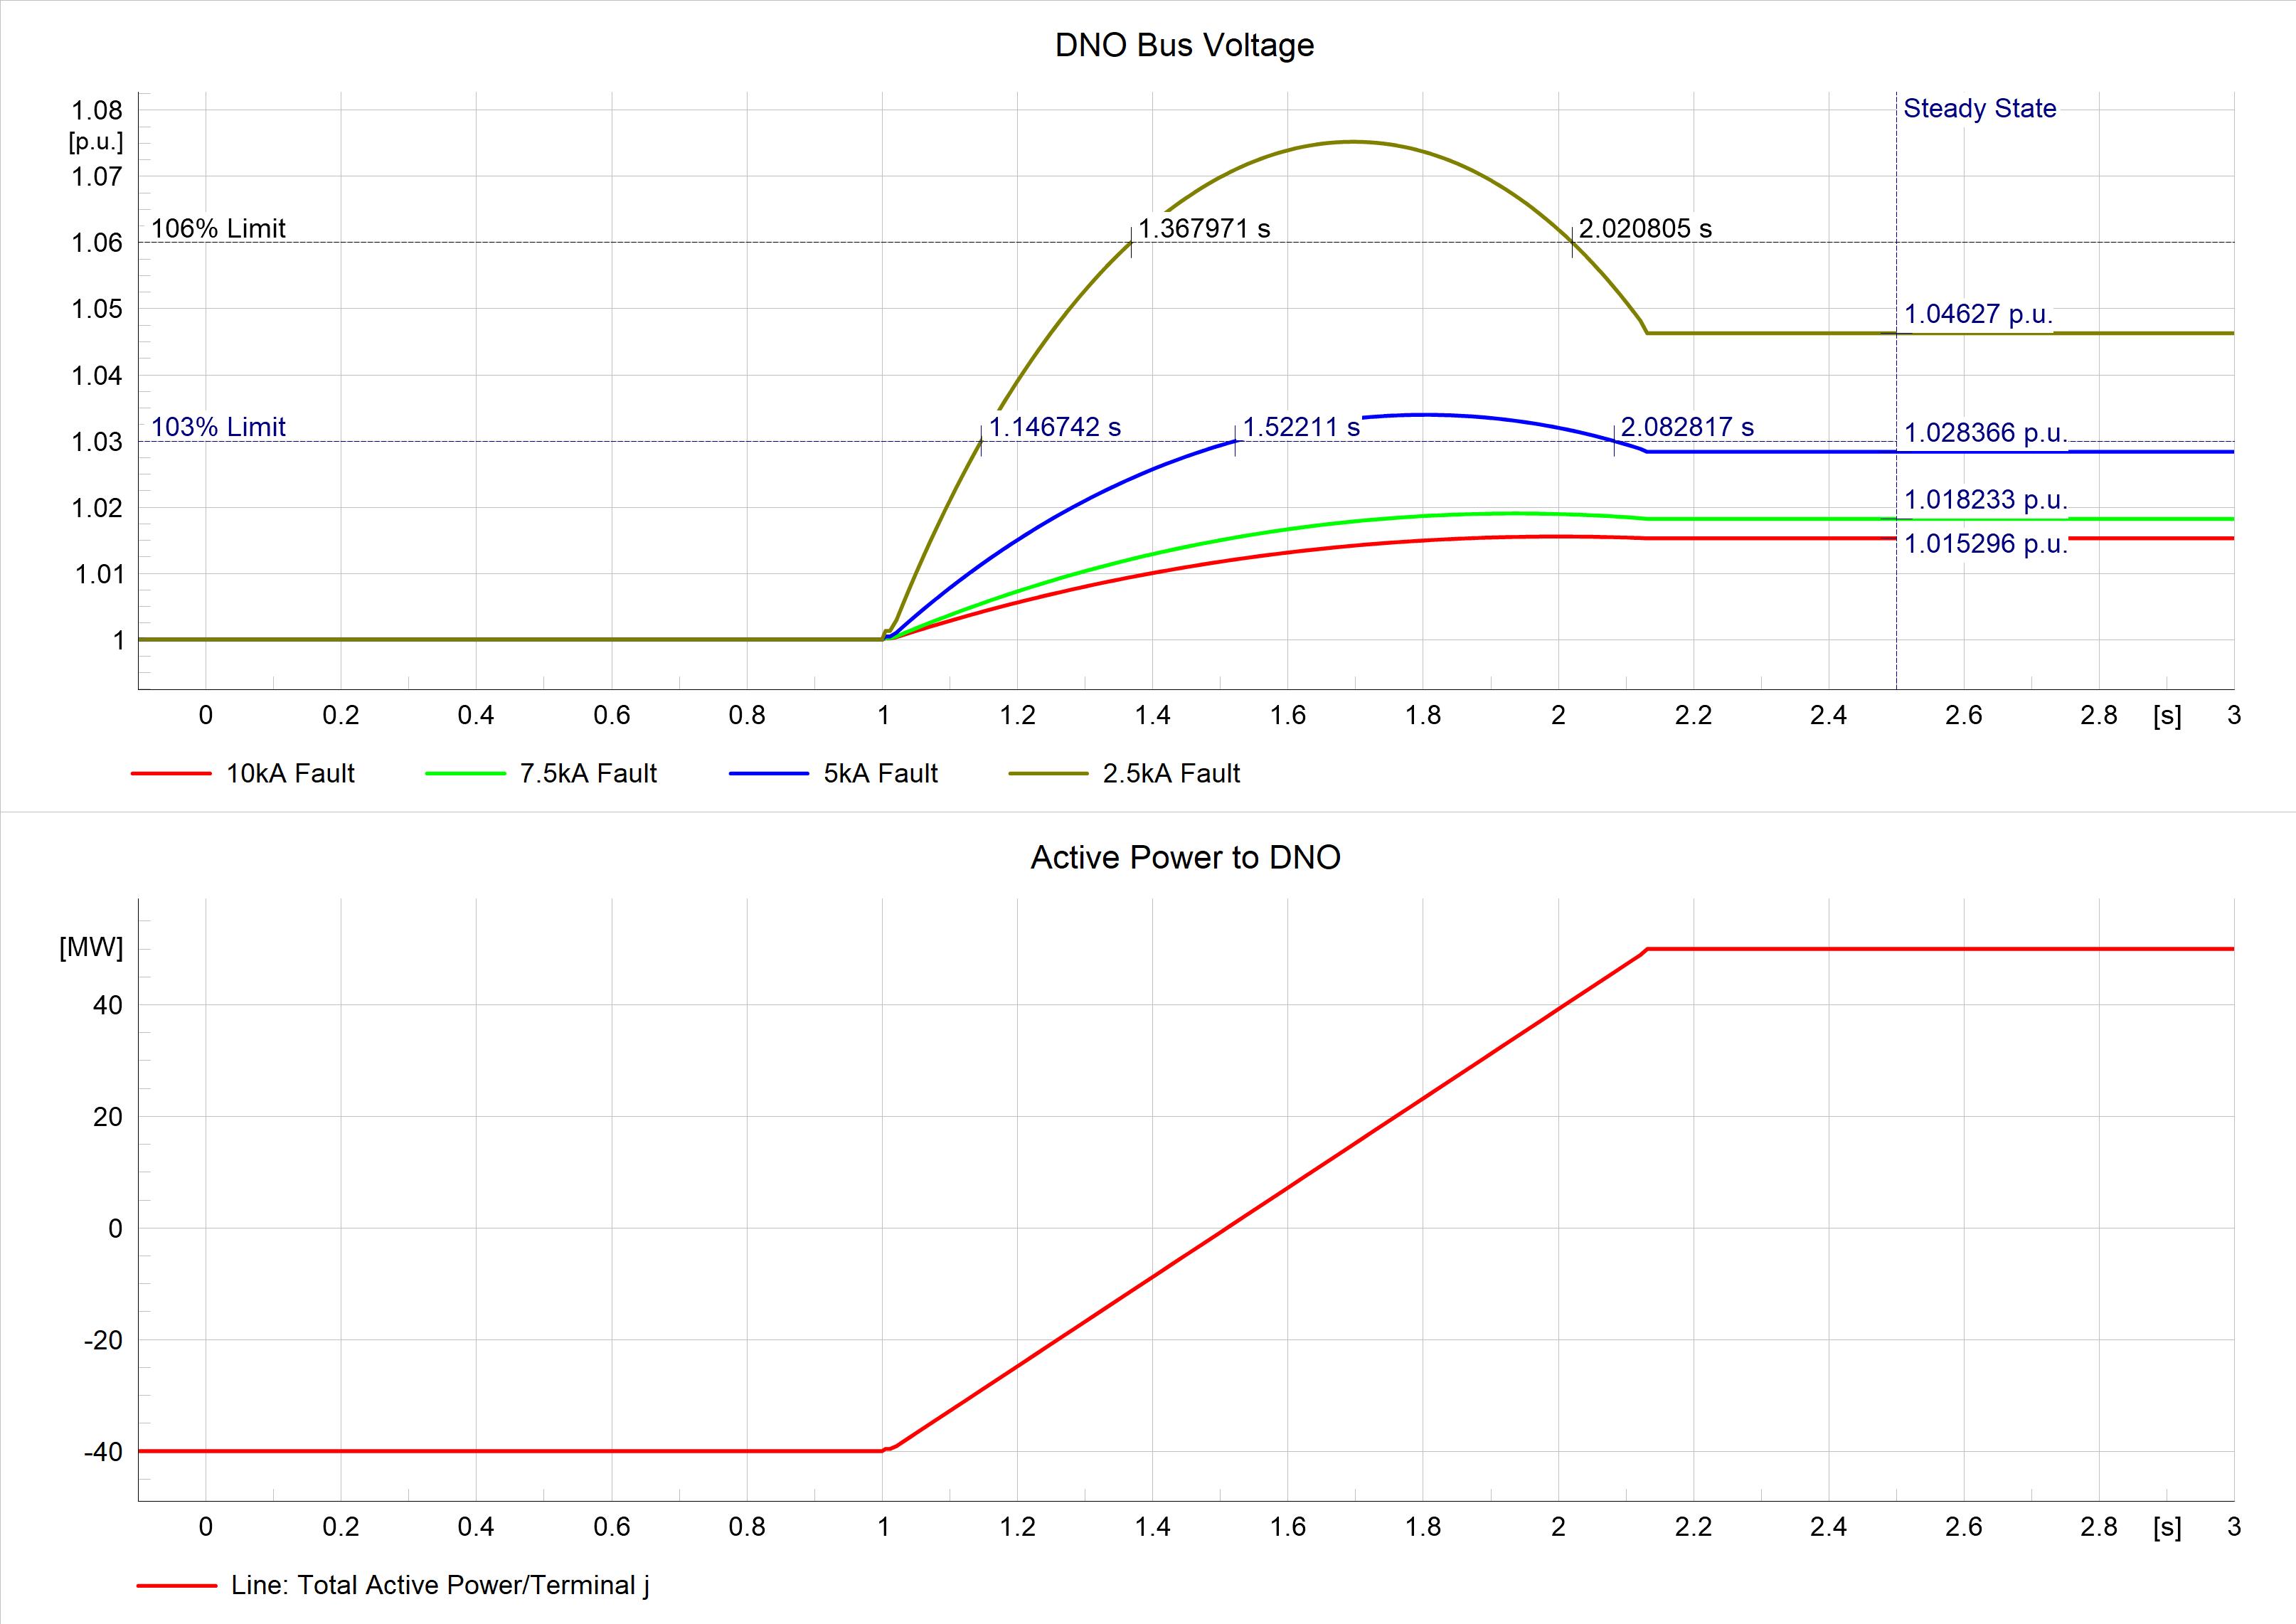
Figure 4 DC Performance Requirements
We can see from the above that one case is clearly unacceptable, one is technical ok, but a marginal pass, and the other two cases pass ok. Unfortunately, with BESS projects, if you fail the P28/2 limits, there are only limited parameters you can play with to improve the P28/2 compliance, and the tricks we have available as designers are a bit limited. We could deploy a reactive power controller, which would try and limit the voltage rise, but this is frowned on by the DNO and likely to become specifically prohibited soon.
Part 4: Summary
We have seen in this post that the Dynamic Containment services are slightly more complicated than may be understood by some developers, and that simply assessing the available capacity at a substation is not enough. Battery storage & p28/2 are a complex area and c0nsideration also needs to be given to the impact the battery power swing can have on the host DNO/TSO network, and consideration given to see if the design will be compliant with the ENA P28/2 standard; as weak electrical networks may well struggle to contain the voltage rise associated with large DC facilities. If you are not sure if your proposed battery storage system is going to meet the ENA P28/2 requirements, please get in touch and we would be happy to carry out some analysis for you.
As a final thought, the UK market is changing rapidly, and National Grid ESO have just published their short-term roadmap to 2025, which contains a number of important changes. Dynamic Containment (DC) will continue to be a major factor, and the new services of Dynamic Moderation (DM) and Dynamic Regulation (DR) will start to be rolled out at the end of the year. Watch this space for future updates.
[1] Well worth a read – but it isn’t exactly a page turner!